In the aftermath of a near-fatal incident at a Pennsylvania rally, Donald Trump has developed a peculiar attachment to a bar chart depicting U.S.-Mexico border crossings. This graphic, which he credits with inadvertently saving his life, has become a recurring element in his 2024 presidential campaign.
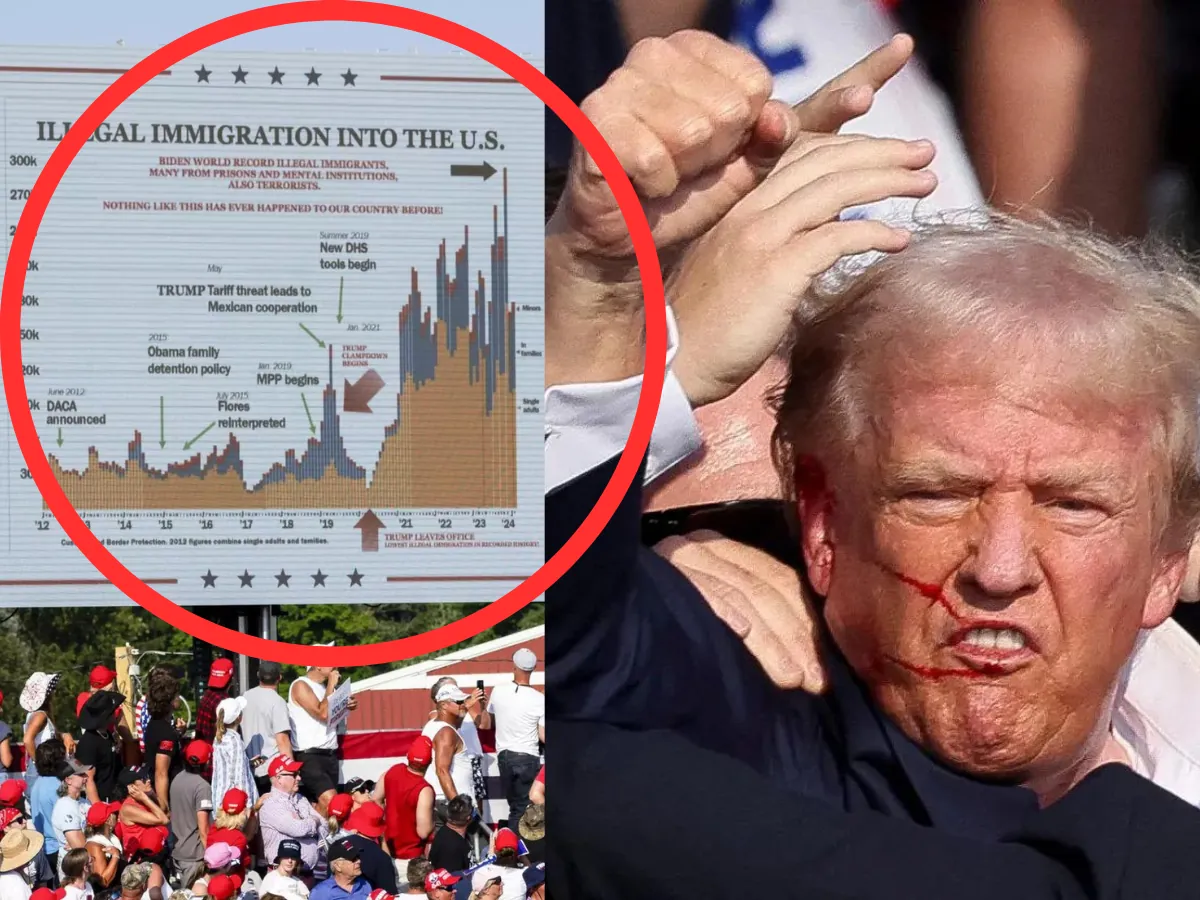
The chart in question compares border crossing statistics during Trump's administration with those of President Joe Biden's term. It gained significance when Trump, while reviewing the graphic at a Butler rally, narrowly escaped serious injury as a bullet grazed his ear. Since then, Trump has repeatedly expressed his affection for the chart, even claiming to "love that chart more than I even love the police."
The origin of this now-famous chart can be traced back to U.S. Sen. Ron Johnson, who shared it with Trump during a flight in April 2024. Johnson's team created the graphic using U.S. Border Patrol statistics, which Trump's campaign subsequently modified before introducing it at a Michigan event.
"It's obvious what the Biden administration has done in that chart. It shows what Trump had to deal with and how he successfully dealt with it."
The chart highlights policies implemented during Trump's tenure, such as the "Remain in Mexico" program, which required asylum seekers to wait south of the border. However, critics point out several inaccuracies and omissions in the graphic.
U.S. Rep. Robert Garcia, a California Democrat, recently highlighted an error in the chart's timeline during a congressional hearing. The graphic incorrectly marks Trump's departure from office, placing it in spring 2020 instead of January 2021.
Notably absent from the chart is any mention of the controversial family separation policy implemented between 2017 and 2018. This omission has drawn criticism from opponents who argue it presents an incomplete picture of Trump's immigration record.
The Border Patrol, established in 1924, has recorded approximately 7.1 million arrests of individuals crossing illegally from Mexico since the beginning of the Biden administration through July 2024. However, it's important to note that this figure includes repeat crossers.
Trump's use of the chart aligns with his longstanding focus on immigration issues. The U.S.-Mexico border, spanning approximately 1,954 miles, has been a central topic in American politics for decades. Since the first border fence was constructed in 1909 near Calexico, California, border security measures have evolved significantly.
The chart has become a staple in Trump's campaign events, including his recent border visit to Arizona and his Republican National Convention speech. As he prepares to return to Butler, it's likely that this graphic will continue to play a prominent role in his campaign narrative.
While the chart serves as a powerful visual aid for Trump's immigration stance, it also highlights the complex nature of border policy and the challenges in presenting comprehensive data on such a multifaceted issue.